Executive dashboard
One dashboard. Every insight that matters.
Understanding your digital performance shouldn’t mean switching between reports, dashboards and marketing tools. Adviora brings every signal — from AI visibility and technical SEO to competitor intelligence and customer discovery — into one unified view.
- AI Score
- Once connected
- AI Visibility
- Once connected
- Trust & Authority
- Once connected
- Technical health
- Once connected
Why it matters
Marketing decisions shouldn’t rely on disconnected data
- What the meeting asks for
- The three or four figures that indicate whether visibility is improving, and a straight answer on why. Nobody in a board meeting wants twelve tools’ worth of raw data.
- What producing it costs
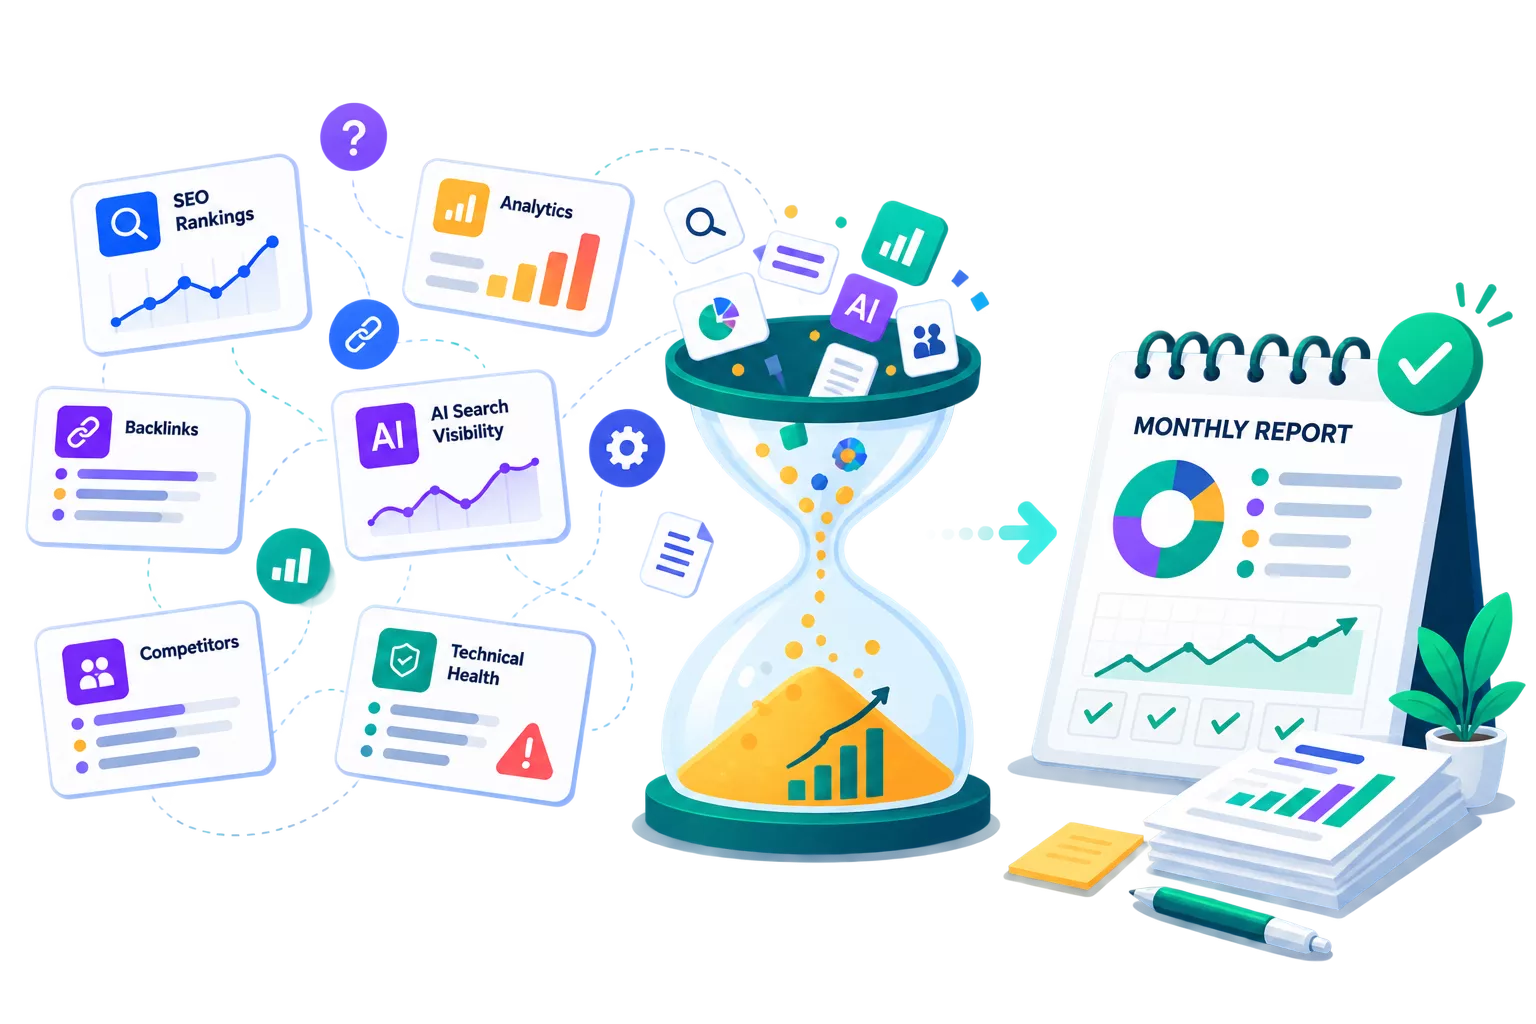
- SEO tools report rankings. Analytics reports traffic. Backlink platforms measure authority. AI search adds another layer entirely — and marketing leaders are left connecting the pieces by hand, which is why the answer is always a month old.
The one number
Your Adviora Trust Score
Four signals, weighted and rolled into a single score you can put in front of a board — and the same score the app calls the Effective Trust Deficit Score (ETDS). One number to open with, four to answer the follow-up question.
- Visibility
- Where you surface in search and answer engines, tracked as a trend rather than a ranking snapshot.
- Technical health
- Crawlability, speed, schema and indexability — the conditions that decide whether anything else counts.
- Authority
- Who vouches for you, who mentions you without linking, and how much weight those signals carry.
- Brand trust (E-E-A-T)
- Experience, expertise, authoritativeness and trust, scored the way search and AI systems actually weigh them.
Everything in one place
What Adviora brings together
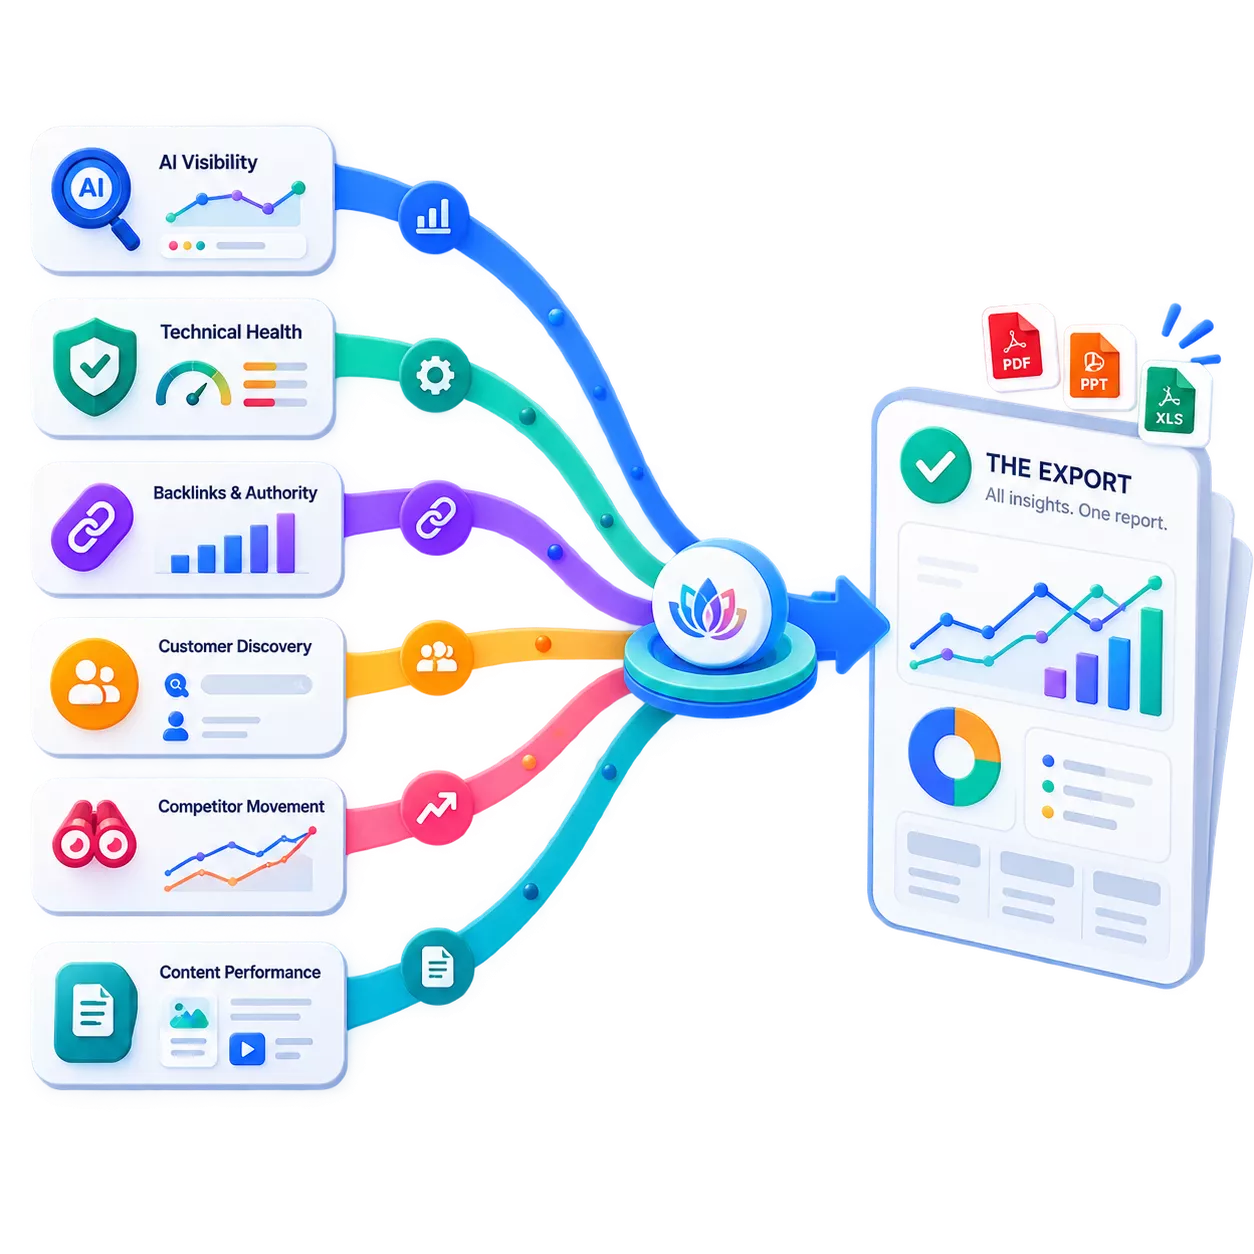
Unified into one exportable, presentation-ready view that updates itself.
| What comes in | What the dashboard shows |
|---|---|
| AI visibility | One trend line across every platform Adviora monitors, instead of a tab per assistant checked by hand. |
| Technical health | A single health score moving over time, rather than a crawl report listing every page at once. |
| Backlinks and authority | Referring-domain and authority movement, weighted by relevance to your category rather than counted. |
| Customer discovery | What buyers are actually asking, and which of those questions your pages currently answer. |
| Competitor movement | Your share of visibility against the set, and which rivals gained or lost since your last visit. |
| Content performance | Coverage and performance per topic, so the gap between what you publish and what is asked is visible. |
One export
Ready to present without reformatting, and the same numbers for everyone who opens it — so the meeting is about the work rather than about whose figures are right.
See what changed
Digital visibility changes every day
Instead of reviewing individual reports, the dashboard highlights what has moved since your last visit — so your team spends less time finding changes and more time responding to them.
- Visibility improvements
- New technical issues
- Competitor movement
- Customer demand shifts
- AI recommendation trends
- Authority improvements
- Content opportunities
Prioritise what matters most
Not every issue deserves immediate attention
Every opportunity is weighed on potential impact before it is recommended, and every recommendation arrives with the context needed to act on it.
- Priority level
- Business impact
- Supporting evidence
- Recommended action
- Expected outcome
Built for every team
One platform, six different lenses
Every stakeholder views the same intelligence through the questions their own role is measured on.
Founders
Growth without the technical report
Whether the business is becoming easier to discover, in the terms a founder actually thinks in.
Marketing leaders
Campaigns, content and priorities
Which initiatives deserve the quarter, and what the last one actually returned.
SEO specialists
Health, visibility and priorities
Technical health and discoverability in one view, with the optimisation queue beside it.
Content teams
Demand and AI search
The opportunities that line up with what customers are asking and what AI platforms are answering.
Agencies
Many clients, one workspace
Monitor every account and communicate results through executive-ready reporting.
Executives
Business-focused metrics
Digital growth measured as an outcome rather than as isolated marketing data.
Where this connects
On-Page · Off-Page · AEO · AI Visibility · GEO
No signal here works alone. This is what each of the five becomes once it reaches the executive view — the lane, and its roll-up.
- On-Page
- On-page health scores roll up into a single trend line instead of a page-by-page audit nobody reads.
- Off-Page
- Backlink and authority trends are summarised alongside on-page performance, so the context arrives with the number.
- AEO
- AEO visibility is tracked over time, which is what shows leadership whether answer-engine presence is actually growing.
- AI Visibility
- One AI Visibility trend line replaces manually checking what AI tools say about your brand.
- GEO
- Executive reporting includes how generative engines currently describe your brand, tracked as a metric rather than a one-off search.
Aria
Ask questions. Get answers.
The Executive Dashboard works with Aria, so you can interrogate a number rather than searching through the reports underneath it.
Aria researches the underlying signals, explains what it found in plain language, and helps your team move forward with confidence.
See how Aria works- Why did our AI Score change?
- Which competitors improved their visibility?
- What should we prioritise this week?
- Which recommendations will have the biggest impact?
Why teams choose it
One connected view against traditional reporting
| Traditional reporting | Adviora |
|---|---|
| A tool per signal, and a tab per tool | One workspace where every signal is already connected |
| Metrics that disagree, because each tool counts them differently | One Adviora Trust Score, and the four signals behind it |
| A monthly deck rebuilt by hand from a dozen exports | One export that updates itself and needs no reformatting |
| You go looking for what changed, if there is time | What moved since your last visit, surfaced on arrival |
| Hundreds of issues, ranked by nothing in particular | Recommendations ranked on business impact, with the evidence attached |
| Technical output handed to a non-technical reader | Plain-language answers — ask Aria why a number moved |
By the numbers
Figure pending — awaiting verified data
Teams using the executive dashboard in Adviora report spending far less time compiling reports by hand.
Illustrative, not a measured result. This section is held for a sourced figure before launch.
Frequently Asked Questions
The central workspace inside Adviora. It combines insights from AI Visibility, Technical SEO, Customer Discovery, Competitor Universe, Trust & Authority, Content Intelligence and the other intelligence layers into one unified view.
Traditional dashboards show individual metrics side by side. The Executive Dashboard connects the layers, so you can see the relationships between them and prioritise the actions that support business growth.
Yes. The dashboard refreshes continuously as Adviora analyses your connected data sources and monitors changes across your digital presence. Nobody has to rebuild it.
Yes. Founders, executives, marketers, SEO specialists, agencies and content teams all work from the same platform while focusing on the information relevant to their responsibilities.
Yes. Aria answers questions about dashboard metrics, recommendations, competitors, AI visibility and customer behaviour through ordinary conversation.
Ready to see the complete picture?
Stop switching between disconnected reports. Bring every insight together in one Executive Dashboard.
What gets shared
- One link, however many people read it
- Your Adviora Trust Score, and the four signals behind it
- Every roll-up and the trend behind each
- An export that needs no reformatting
- Updated on its own, not on your Friday